Location :
Orlando, FL, USA
Location :
Orlando, FL, USA +1 (407) 714-1616
 info@biz4group.com

 AI Summary Powered by Biz4AI
- DFS projection models combine historical game logs, player statistics, usage patterns, salaries, and current data to estimate expected fantasy performance.
- Historical game logs for DFS help establish player baselines, identify consistency and variance, track role changes, and provide training examples.
- DFS data feeds add current information such as injuries, lineups, schedules, and game updates, helping projections stay relevant as conditions change.
- Model backtesting compares projections with unseen historical outcomes and uses metrics such as MAE, RMSE, bias, and rank correlation to evaluate performance.
- DFS projection platform development costs can range from $10,000 to $180,000+, depending on data licensing, model complexity, real-time processing, sports coverage, infrastructure, and ongoing maintenance.
- Biz4Group LLC combines AI development, sports application expertise, data integrations, and custom product development to help businesses turn DFS projection concepts into scalable platforms.
What happens when a daily fantasy sports (DFS) projection looks convincing on paper but misses the player’s actual opportunity?
That question matters because fantasy sports audiences are getting more comfortable with data-led decision making. In July 2026, the Fantasy Sports & Gaming Association reported that 31% of U.S. adults, or about 82.8 million people, had played fantasy sports or bet on sports in the previous 12 months. The same study found that 25% of fantasy players and sports bettors were already using AI tools to inform decisions.
For businesses building the next generation of fantasy products, that raises the bar.
Unlike season-long fantasy, DFS evaluates players within individual slates, so projections need to account for current matchups, player availability, salaries, and contest-specific scoring rules.
So, how do DFS projection models work when all these inputs come together?
DFS projection models combine historical player performance, game logs, usage patterns, matchup data, salaries, injuries, and current sports data to estimate expected fantasy output. Historical data establishes the player baseline, while live data updates that baseline when new information changes expected opportunity or performance.
This guide breaks down the data pipeline, projection algorithm, accuracy measurement, backtesting process, development roadmap, and cost of building a custom DFS projection platform.
How Do DFS Projection Models Work?
DFS projection models turn player and game data into an estimate of expected fantasy production. The model collects historical and current inputs, converts them into useful features, applies a statistical or machine learning method, and produces a projected fantasy score.
Think of the process as a pipeline.
Data collection → data preparation → feature engineering → projection generation → live updates → validation
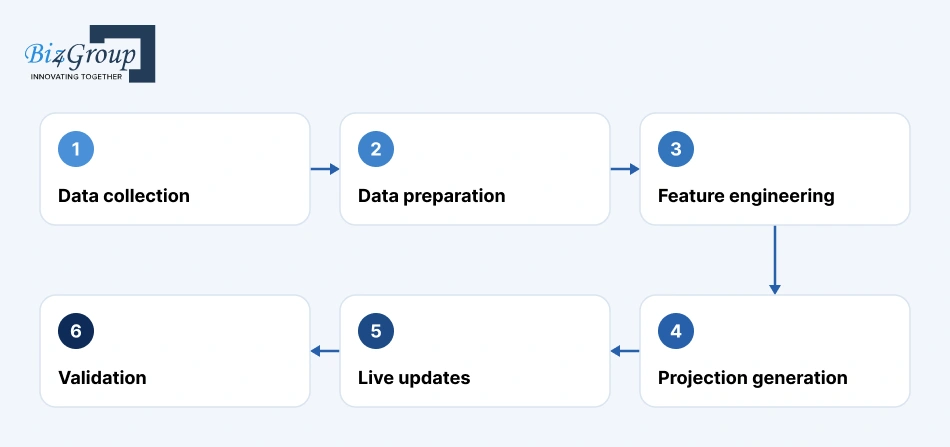
Each stage affects the final number.
|
Stage |
What Happens |
|---|---|
|
Data collection |
Historical statistics, game logs, salaries, injuries, schedules and other inputs are gathered |
|
Data preparation |
Missing, duplicated or inconsistent records are cleaned |
|
Feature engineering |
Raw data becomes meaningful variables such as recent usage or opponent strength |
|
Projection generation |
The DFS projection algorithm estimates expected player output |
|
Projection updates |
New injury, lineup, matchup and player information changes the estimate |
|
Validation |
Historical results are used to measure how closely projections matched actual outcomes |
A good DFS projection model therefore behaves less like a static calculator and more like a living analytical system.
The quality of its inputs matters as much as the sophistication of its model.
What Historical Data Is Needed for DFS Player Projections?
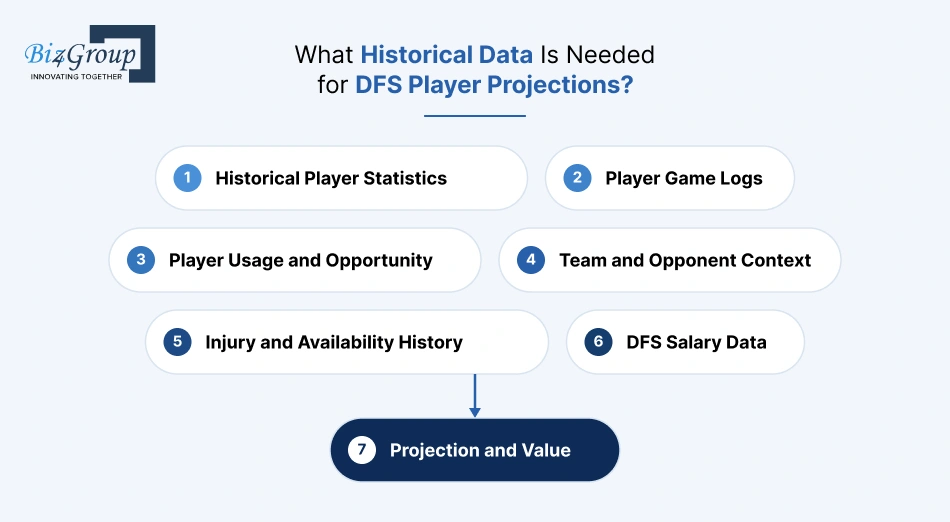
DFS player projections need historical player statistics, game logs, usage data, team context, injuries, salaries, and previous fantasy outcomes. The exact mix depends on the sport and scoring system.
Here is what typically goes into the dataset.
Historical Player Statistics
Points, rebounds, assists, shots, yards, touchdowns, strikeouts, saves, goals and other sport-specific statistics provide the basic performance record.
The model can calculate averages, medians, rates and trends from these records.
Player Game Logs
Game-by-game records add more detail than season averages.
A player averaging 25 fantasy points could have very different underlying patterns. They may score 25 almost every night. Or they may alternate between 10 and 40.
That difference matters in DFS.
Player Usage and Opportunity
Opportunity often explains why production changes.
Useful variables can include:
- Minutes played
- Targets
- Touches
- Shot attempts
- Routes run
- Usage rate
- Rebounds available
- Power-play time
- Team possession
- Starting status
The model can then distinguish a player who is producing efficiently from one receiving a larger workload.
Team and Opponent Context
Historical sports data for DFS becomes more useful when the surrounding game is included.
Opponent defensive strength, pace, projected scoring, team totals and positional matchups can all influence expected output.
Injury and Availability History
Injuries affect both the player and everyone around them.
A missing starter can increase another player's minutes or touches. A returning player can reduce that opportunity.
That makes injury history useful for understanding changing roles.
DFS Salary Data
DFS salary is primarily a value and lineup-construction input, not a direct measure of expected fantasy points. The projection model estimates player output, while salary helps calculate metrics such as fantasy points per dollar and determine how that projection fits within contest constraints.
A player projected for 30 fantasy points at a $10,000 salary has a different value proposition from a player projected for 27 points at $5,000.
A mature model can therefore connect expected production with DFS salary data and value calculations.
Projection and Value
The final dataset can support both projected fantasy points and expected value.
That distinction becomes particularly important when a DFS platform wants to help users compare players across salary ranges.
How Do Historical Game Logs Improve DFS Projection Accuracy?
Historical game logs improve DFS projections by giving models player-specific baselines, performance patterns, variance, role changes and training examples.
But there is a catch.
Old data can become stale.
A player who changed teams, lost playing time or gained a larger role six months ago may no longer resemble their historical profile. This is why a strong model does not treat every game equally.
They Establish Player-Specific Baselines
Historical logs answer a basic question... What does this player typically produce under comparable conditions?
The model can establish a baseline using averages, rolling averages, medians or more sophisticated statistical methods.
They Reveal Consistency and Variance
Two players can have the same average fantasy score with very different distributions.
Historical logs allow the model to identify that difference. That can help a DFS platform expose projected ranges, volatility or ceiling and floor estimates.
They Capture Role Changes
Game logs can reveal shifts in opportunity. A player suddenly receiving more minutes or targets may show a different production pattern from their earlier season average.
Recent observations can therefore receive greater weight.
They Provide Training Examples
For machine learning models, historical game logs provide examples of inputs and outcomes.
The model learns relationships between factors such as opportunity, matchup and player performance. It can then apply those learned relationships to upcoming contests.
They Support Recency Weighting
Should a game from three seasons ago count the same as one from last week?
Usually, no.
Recency weighting can give newer observations more influence while retaining enough historical information to avoid overreacting to a small sample. That balance is one of the practical decisions involved in building accurate DFS prediction models.
How Do DFS Data Feeds Complement Historical Game Logs?
DFS data feeds complement historical game logs by supplying current schedules, player information, scores, game states, injuries and other updates that historical datasets cannot provide.
Historical data tells the model what has happened. Current feeds tell it what has changed.
For example, SportsDataIO's current API documentation includes athlete, team, schedule, score and game-state data. SportsDataIO documents refresh intervals that vary by endpoint and data type. Some supported live feeds can refresh at five-second intervals, so verify the relevant endpoint's documentation before setting polling frequency.
That creates a two-layer data architecture.
|
Historical Layer |
Current Layer |
|---|---|
|
Player game logs |
Latest player status |
|
Past fantasy points |
Current game information |
|
Historical usage |
Current lineup |
|
Previous matchups |
Current opponent context |
|
Past salaries |
Current DFS salary |
|
Previous injuries |
Latest availability |
A DFS data feed can therefore trigger a projection refresh when an important variable changes. That might be a late lineup announcement, injury update, roster change or other game-day event.
Common commercial sports-data providers include SportsDataIO, Sportradar, Stats Perform, and FantasyData. Their available sports, endpoints, historical coverage, licensing terms, update frequency, and pricing differ, so the right provider depends on the platform's sport coverage and data requirements.
Also read: Why top US betting apps rely on multiple sports data providers?
Bad Data Makes Bold Predictions
Your model deserves better than stale stats. Build a data pipeline that keeps up with the game.
Build My DFS Data PipelineWhich Factors Does a DFS Projection Algorithm Analyze?
A DFS projection algorithm analyzes player performance, recent form, opportunity, matchup, injuries, team context, venue conditions, salary and lineup changes before producing an expected fantasy score.
The calculation can be visualized as three layers.
Baseline Projection Historical performance establishes the starting estimate.
Contextual Adjustments Current opportunity, opponent, injuries, weather, team changes and other relevant conditions modify that estimate.
Expected Fantasy Points The final model converts the adjusted performance estimate into the scoring system used by the DFS contest.
For example, a basketball model might consider:
- Recent minutes
- Usage rate
- Shot attempts
- Rebounding opportunities
- Assist opportunities
- Opponent pace
- Defensive matchup
- Injury-related role changes
- Expected game total
- DFS salary
A football model would use a different feature set.
That is why there is no universal DFS projection algorithm that works identically across every sport.
The scoring rules, available data and player behavior all change.
Which Algorithms Are Used in DFS Projection Models?
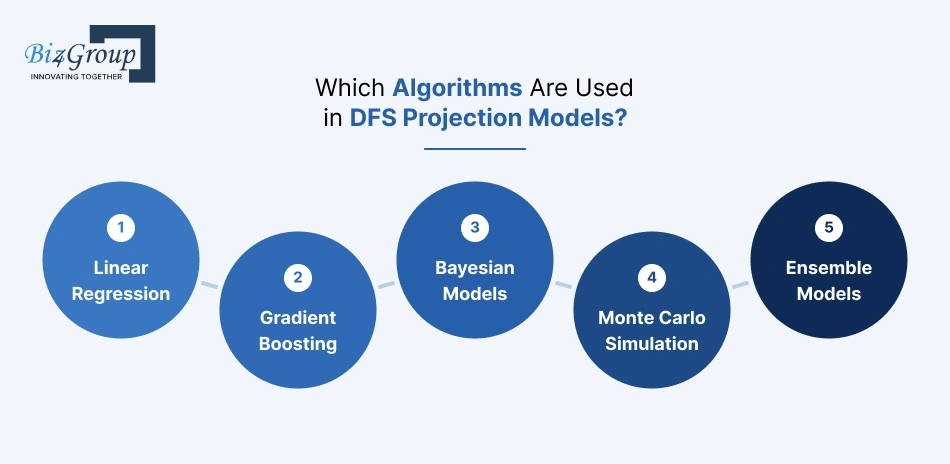
DFS projection models can use several statistical and machine learning approaches. The right choice depends on the sport, available data, projection horizon, amount of historical data, and whether the system needs point estimates or full outcome distributions.
|
Approach |
Best Fit |
What It Does |
|---|---|---|
|
Linear Regression |
Strong baseline |
Estimates fantasy output from measurable relationships |
|
Gradient Boosting |
Complex player features |
Captures nonlinear relationships between variables |
|
Bayesian Models |
Limited or uncertain data |
Incorporates prior knowledge and updates projections as new evidence arrives |
|
Monte Carlo Simulation |
Ceiling, floor, and distributions |
Generates many possible outcomes to estimate ranges and probabilities |
|
Ensemble Models |
Production-grade systems |
Combines multiple models to reduce dependence on one modeling approach |
For many production systems, an ensemble can be more practical than relying on one algorithm. A model may use regression as a baseline, gradient boosting for nonlinear adjustments, and simulation to turn the final estimate into an outcome distribution.
Worked Example: Turning Player Data into a DFS Projection
Imagine an NBA player has a historical baseline of 34 fantasy points per game.
The model then evaluates several current factors:
- Recent usage suggests a higher workload: +2.5 points
- Opponent matchup adds: +1.5 points
- A teammate's absence increases expected opportunity: +2 points
- Recent shooting efficiency is slightly below baseline: −1 point
Projected fantasy points = 34 + 2.5 + 1.5 + 2 − 1 = 39 fantasy points
The model can then use the player's historical variance and simulation layer to estimate a broader outcome range instead of treating 39 as a guaranteed result.
The example is illustrative, not a claim that DFS projections should use fixed point adjustments. Production models typically learn feature relationships from historical data instead of relying on manually assigned weights.
Projection is also an input for lineup optimization. Once expected points, value, ownership, and outcome ranges are available, an optimizer can use salary caps, roster rules, exposure limits, and contest type to generate eligible lineups.
How Do DFS Models Measure Prediction Accuracy?
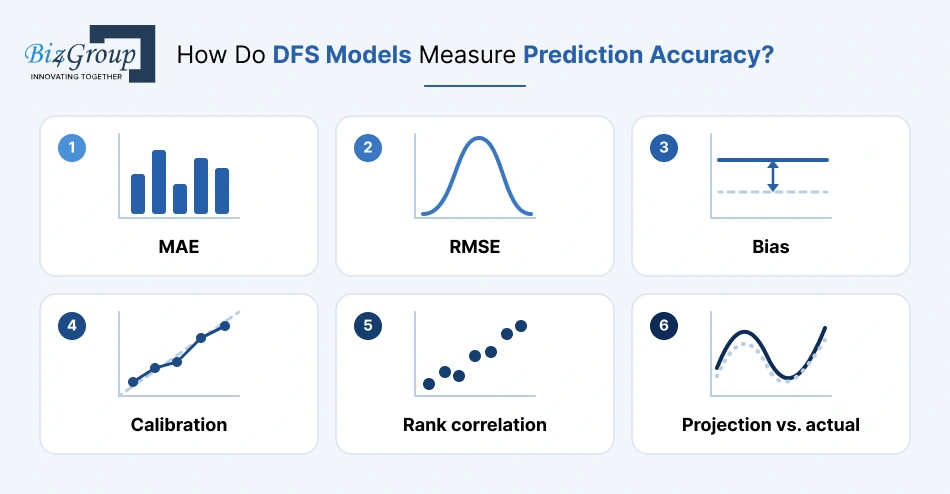
DFS models measure prediction accuracy by comparing projected fantasy points with actual fantasy points and tracking errors across many observations.
A single successful prediction proves very little. A useful evaluation framework looks at the model across a historical test set.
|
Metric |
What It Shows |
|---|---|
|
MAE |
Average absolute difference between projected and actual results |
|
RMSE |
Gives greater weight to larger prediction errors |
|
Bias |
Shows whether the model systematically overpredicts or underpredicts |
|
Calibration |
Measures how well predicted ranges correspond with actual outcomes |
|
Rank correlation |
Shows whether players are ordered similarly to their eventual performance |
|
Projection vs. actual |
Provides a direct view of model performance |
What Is a Good DFS Projection MAE?
There is no universal MAE threshold for DFS projections. A 5-point error can mean something very different for a high-scoring quarterback than for a lower-scoring player in another sport. MAE should therefore be compared against the same sport, position, scoring system, slate type, and historical period.
A stronger evaluation compares the model with a simple baseline, such as a rolling player average, and tracks performance across multiple slates. If the custom model does not consistently outperform that baseline, its additional complexity may not be justified.
For example, a DFS projection model could be tested against a 5-game rolling average. If the machine learning model produces a lower MAE across unseen slates, the additional features and modeling complexity have demonstrated measurable value.
A single projected score also hides uncertainty. A model can produce a median projection alongside a ceiling, floor, and probability distribution. Simulation methods such as Monte Carlo can generate thousands of possible outcomes, helping the platform estimate how often a player reaches specific fantasy-point thresholds.
This becomes especially useful for DFS lineup construction because cash-game decisions and tournament decisions may value different parts of the outcome distribution.
Better Projections. Smarter ROI.
Is your model earning its complexity? Benchmark accuracy, uncover costly errors, and build toward better returns.
Explore My DFS ROI PotentialHow Does Backtesting Improve a DFS Projection Model?
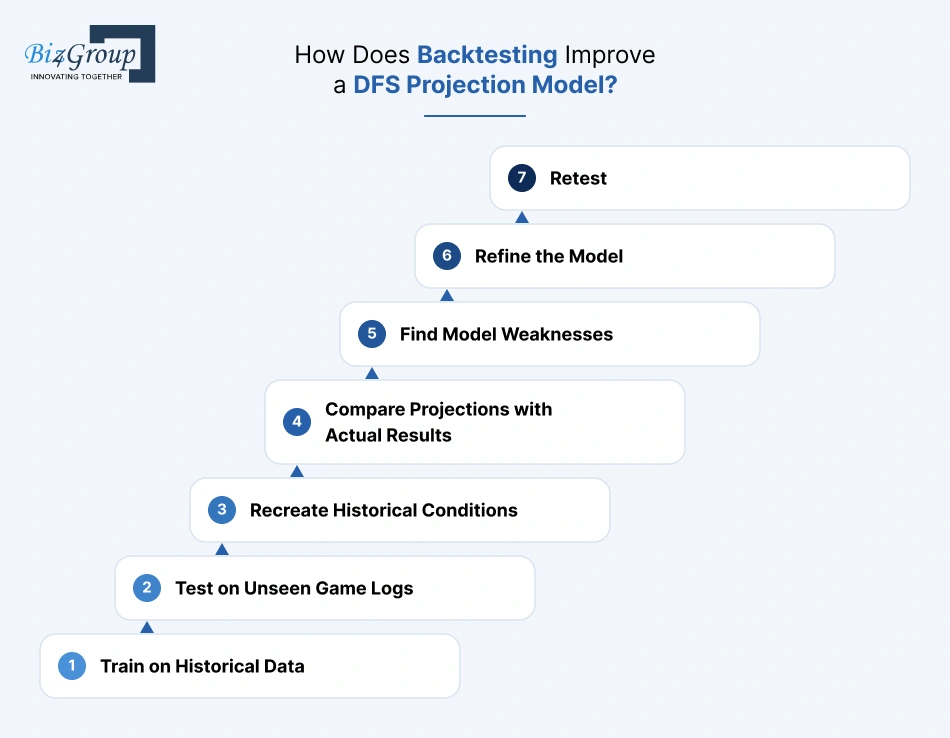
Backtesting improves a DFS projection model by testing its predictions against historical game conditions that were not used to train the model.
The process should resemble the conditions the model will face after launch.
1. Train on Historical Data The model learns from an earlier period of player and game records.
2. Test on Unseen Game Logs A separate historical period is held back. The model generates projections without seeing the eventual outcomes.
3. Recreate Historical Conditions The test should use the information that would have been available before the game. That means avoiding future injury information, final scores or other data that would create hindsight bias.
4. Compare Projections with Actual Results The platform calculates error metrics and identifies recurring weaknesses.
5. Find Model Weaknesses Perhaps the model overvalues recent form. Maybe it reacts too slowly to role changes. Perhaps it struggles with rookies who have limited historical data.
6. Refine the Model Features, weights, training windows or algorithms can then be adjusted.
7. Retest The revised model goes through another evaluation cycle. The biggest technical risk here is data leakage.
Avoid Data Leakage
Data leakage can make a DFS projection model look far more accurate than it really is. During backtesting, every feature must reflect information that would have been available at the time of the original projection. Post-game statistics, later injury updates, finalized lineups, or future performance data should never influence an earlier prediction.
Time-based validation is especially important for DFS because the model is predicting future slates from past information. A walk-forward approach trains on earlier periods, tests on the next period, then advances the training window and repeats the process.
Use Walk-Forward Validation
DFS projection models work with time-dependent data, so random train-test splits can produce misleading results. Walk-forward validation keeps the timeline intact. The model trains on an earlier period, predicts the next slate or time window, records the result, then moves the training window forward and repeats the process.
For high-quality backtesting, the system should also preserve point-in-time inputs. The model should only see the injury status, lineup information, salaries, projections, and other data that would actually have been available before that historical slate locked.
How Do You Build a Custom DFS Projection Model?

You build a custom DFS projection model by defining the scoring objective, integrating historical and current data, preparing the data, designing the interface, developing an MVP, training the model, and monitoring its performance.
Here is a practical seven-step roadmap.
Step 1. Define the Sport and Projection Goals
Start with the sport, DFS scoring rules, target users and projection outputs.
Decide whether the product needs player projections, value scores, ceiling and floor estimates, lineup recommendations or broader analytics.
Step 2. Select Historical and Real-Time Data Sources
Identify the required player statistics, game logs, salaries, injuries, schedules and contextual data. Then select appropriate sports data APIs and define the update frequency.
This is also where licensing and data coverage should be reviewed.
Also read: Why enterprise sports data APIs like Sportradar matter more than features?
Step 3. Build the Data Pipeline
Historical and live information needs to reach a common data layer. Records should be normalized across players, teams, games, seasons and competitions.
A well-designed sports data API integration layer also makes it easier to replace or add providers later.
Step 4. Design the UI/UX
The model can be statistically impressive and still produce a frustrating product.
A UI/UX design company can help shape dashboards that make projections, confidence ranges, player comparisons and updates easy to understand.
The interface should answer practical questions quickly. Who is projected highest? Who offers the most value? What changed since the previous update?
Also read: Top 15 UI/UX design companies in USA
Step 5. Develop the MVP
Build the smallest useful version of the DFS projection platform around its core workflow.
An MVP could include player projections, salary data, basic filters, projection updates and historical performance comparisons.
Using MVP development services can help structure this stage around a testable product before expanding into more advanced functionality.
Also read: Top 12+ MVP development companies in USA
Step 6. Train and Backtest the Model
Train the selected model using historical records. Then run controlled backtests against unseen data.
Track MAE, RMSE, bias and other relevant measures before exposing projections to users.
For products that need broader AI capabilities, teams such as Biz4Group can combine AI integration services with data engineering and model development to connect prediction logic with the product layer.
Step 7. Connect Live Updates and Monitor Performance
The final stage connects real-time data feeds and creates monitoring systems. The model should track prediction errors over time.
When performance drifts, the team can investigate the underlying cause and retrain or recalibrate the model.
That makes DFS algorithm development an ongoing product discipline, not a one-time launch task.
All Chalk and DFS Projection Models in Practice
All Chalk, developed by Biz4Group, shows how a sports prediction product can combine multi-sport data, real-time updates, prediction features, and user engagement in one platform. The platform supports predictions across 30+ sports, with real-time scores, statistics, match updates, leaderboards, schedules, and reminders.
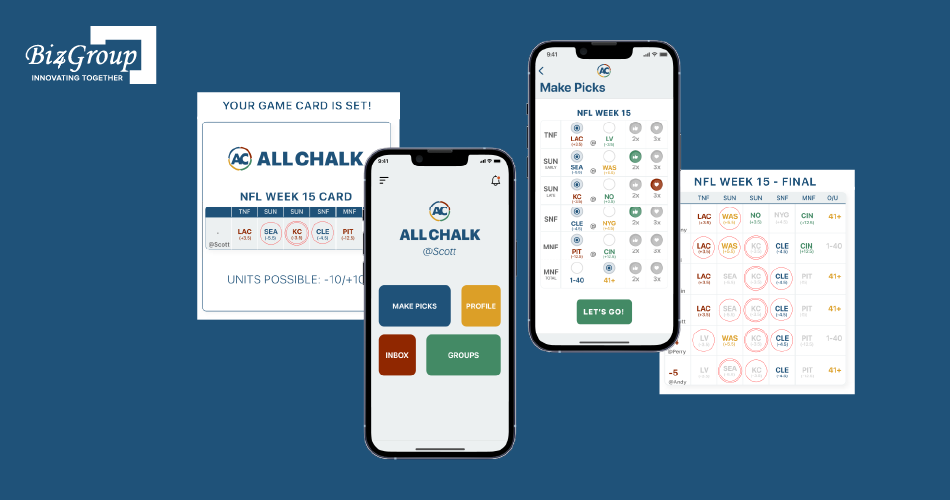
The project was delivered by a 7-person team. Its technology stack included Ionic, React.js, Express.js, PostgreSQL, and AWS, supporting cross-platform delivery and real-time synchronization.
For a DFS projection platform, the relevant takeaway is architectural: projection logic needs to sit within a broader data and application layer that can ingest sports information, update user-facing results, and scale across multiple sports.
Your DFS Idea Called. It Wants a Game Plan.
Seven development steps are the starting lineup. Let's map yours to a launch-ready product.
Call Biz4Group NowWhat Does It Cost to Develop a DFS Projection Platform?
A custom DFS projection platform typically costs about $10,000 to $180,000+ based on Biz4Group's development experience. The final figure depends on the number of sports, data sources, model complexity, real-time requirements and product scope.
|
Development Scope |
Estimated Cost |
|---|---|
|
Basic projection MVP |
$10,000 to $30,000 |
|
Multi-feature DFS platform |
$30,000 to $75,000 |
|
Advanced prediction platform |
$75,000 to $120,000 |
|
Enterprise-grade multi-sport platform |
$120,000 to $180,000+ |
These are working estimates based on Biz4Group's experience. Actual costs can vary by requirements, team composition, integrations and third-party licensing.
Major Cost Drivers
The cost drivers below are component-level planning estimates, not separate charges that should be added to every project tier. Some costs overlap, and the final quote depends on the selected scope, integrations, and delivery requirements.
|
Cost Driver |
Typical Impact |
|---|---|
|
Data API integration |
$5,000 to $25,000 |
|
Data engineering and normalization |
$8,000 to $30,000 |
|
Projection and ML models |
$15,000 to $60,000+ |
|
Real-time processing |
$8,000 to $30,000 |
|
Multi-sport support |
20% to 45% additional scope |
|
UI/UX and analytics dashboards |
$5,000 to $20,000 |
|
Admin and model monitoring |
$5,000 to $15,000 |
Data licensing can become another significant expense.
The API itself may have subscription tiers, usage limits or commercial licensing terms. Those charges sit outside the development estimate and vary considerably by provider.
Hidden Costs to Budget For
The development quote is only one part of the financial picture.
|
Hidden Cost |
Typical Range |
|---|---|
|
Data licensing |
$500 to $10,000+ per month |
|
Cloud infrastructure |
$300 to $5,000+ per month |
|
Model monitoring |
$1,000 to $5,000 per month |
|
Ongoing maintenance |
15% to 25% of development cost annually |
|
Model retraining |
$2,000 to $10,000 per cycle |
|
Security and compliance work |
$3,000 to $15,000+ |
|
Additional API providers |
$2,000 to $15,000+ annually |
These are planning estimates based on typical project requirements and Biz4Group experience. Actual vendor pricing varies by sport, coverage, usage volume, licensing terms, and contract structure.
Also read: How much does it cost to develop an AI sports app?
What Should Businesses Look for in a DFS Projection Development Partner?
Businesses should look for a DFS development partner with experience across sports data engineering, real-time API integration, statistical modeling, backtesting, fantasy scoring and scalable product development.
Build vs. Buy a DFS Projection Platform
Businesses typically have two paths: license an existing projection solution or build a custom platform. Buying can shorten initial development time, while custom development provides greater control over data pipelines, projection logic, scoring rules, integrations, user experience, and future features.
A practical middle path is to license selected data or projection components while building the proprietary layers that differentiate the product.
A useful evaluation checklist includes:
- Experience with sports data pipelines
- Sports data API integration capabilities
- Statistical and machine learning expertise
- Real-time data processing
- Historical dataset preparation
- Backtesting methodology
- Model monitoring
- Fantasy scoring knowledge
- Scalable cloud architecture
- UI/UX development
- MVP development
- Post-launch model maintenance
There is also a practical question to ask.
Can the development team connect the model to a real product?
A projection algorithm sitting in a notebook has limited commercial value.
The product needs APIs, dashboards, user workflows, admin controls, monitoring and reliable data delivery around it.
DFS Compliance and Responsible Play
If the platform supports paid DFS contests, compliance requirements need to be considered during product planning. DFS rules can vary by jurisdiction, contest format, and product structure, so businesses should verify applicable state requirements with qualified legal counsel before launch. Responsible-play controls should also be built into the product where applicable.
Biz4Group's experience across AI, sports applications and data-centric products allows these components to be approached as one development roadmap. That matters when the goal is to turn fantasy sports projection models into a commercially usable platform.
Wrapping Up
DFS projection models bring several layers of information together to estimate how a player may perform in a fantasy contest. Historical game logs reveal patterns in production, usage, consistency, and role. Current data feeds add the context that can change those expectations before a slate begins. Together, they give projection systems a stronger foundation for generating timely player estimates.
The bigger challenge is turning those estimates into a dependable product. Data pipelines, projection algorithms, backtesting, real-time updates, dashboards, and ongoing model monitoring all have to work together. For businesses building a DFS projection platform, the development strategy matters as much as the prediction model itself.
Biz4Group LLC brings experience across AI development, sports applications, data integrations, and custom product development. That combination helps businesses move from a projection concept to a usable DFS platform with the supporting technology around it.
Got a DFS projection idea? Let’s turn the numbers into your next product. Let’s talk.
FAQs
1. Do DFS projection models account for player ownership?
They can. Ownership projections estimate how many DFS entries are expected to select a player. Combining projected fantasy production with expected ownership can help users identify highly popular plays, lower-owned alternatives, and different lineup strategies.
2. How do DFS projection models handle rookies with limited data?
Models can use alternative signals when a player has little or no professional game history. These can include college statistics, minor-league performance, preseason data, draft information, expected playing time, team context, and comparable player profiles.
3. Can DFS projection models work across multiple sports?
Yes, but each sport needs its own feature set and scoring logic. A basketball model may focus on minutes, usage, rebounds, and assists, while a baseball model may require batting, pitching, ballpark, and matchup-specific variables.
4. Do DFS projection models predict player ceiling and floor?
They can generate ceiling and floor estimates when the model accounts for player variance and different performance outcomes. These ranges can give users more context than a single projected fantasy-point figure.
5. Can DFS projection models support showdown and single-game contests?
Yes. A model can be configured for single-game formats by adjusting its inputs for smaller slates, game-specific opportunities, scoring rules, player pricing, and lineup constraints. The projection framework remains similar, but the contest context changes.
6. What makes a DFS projection model difficult to scale?
Scaling becomes more complex as the platform adds sports, leagues, data providers, users, and real-time updates. The underlying architecture needs to handle larger data volumes while keeping projections, APIs, analytics, and user-facing results synchronized.
7. Can businesses license DFS projections instead of building their own?
Yes. Businesses can license existing projections or build a custom model. Licensing can shorten initial development, while a custom model offers greater control over scoring rules, features, integrations, and product differentiation. Check commercial usage rights, update frequency, and customization limits before choosing.